System Identification with Noisy Data
Exploring a specific graph learning task of reconstructing a symmetric matrix that represents an underlying graph using linear measurements.
Motivation
Symmetric matrices are ubiquitous in graphical models with examples such as the \((0, 1)\) adjacency matrix and the (generalized) Laplacian of an undirected graph. A major challenge in graph learning is inferring graph parameters embedded in those graph-based matrices from historical data or real-time measurements.
Model
We consider the following model:
\[\mathbf{A}=\mathbf{B}\mathbf{Y}(G)+\mathbf{Z}\]where \(\mathbf{A}\) and \(\mathbf{B}\) are real or complex matrices representing measurements of a system; \(\mathbf{Y}(G)\) is a symmetric matrix encoding connectivity of an undirected graph \(G\), such as a generalized Laplacian and \(\mathbf{Z}\) is some additive noise.
Our work considers a sparsity characterization for distributions of random graphs (that are allowed to contain high-degree nodes), based on which we study fundamental trade-offs between the number of measurements, the complexity of the graph class, and the probability of error. We derive a necessary condition and a sufficient condition on the number of measurements for recovery. Furthermore, assuming the measurements are Gaussian IID, we prove upper and lower bounds on the (worst-case) sample complexity for both noisy and noiseless recovery. In the special cases of the uniform distribution on trees with n nodes and the Erdős–Rényi \((n, p)\) class, the fundamental trade-offs are tight up to multiplicative factors with noiseless measurements.
Method
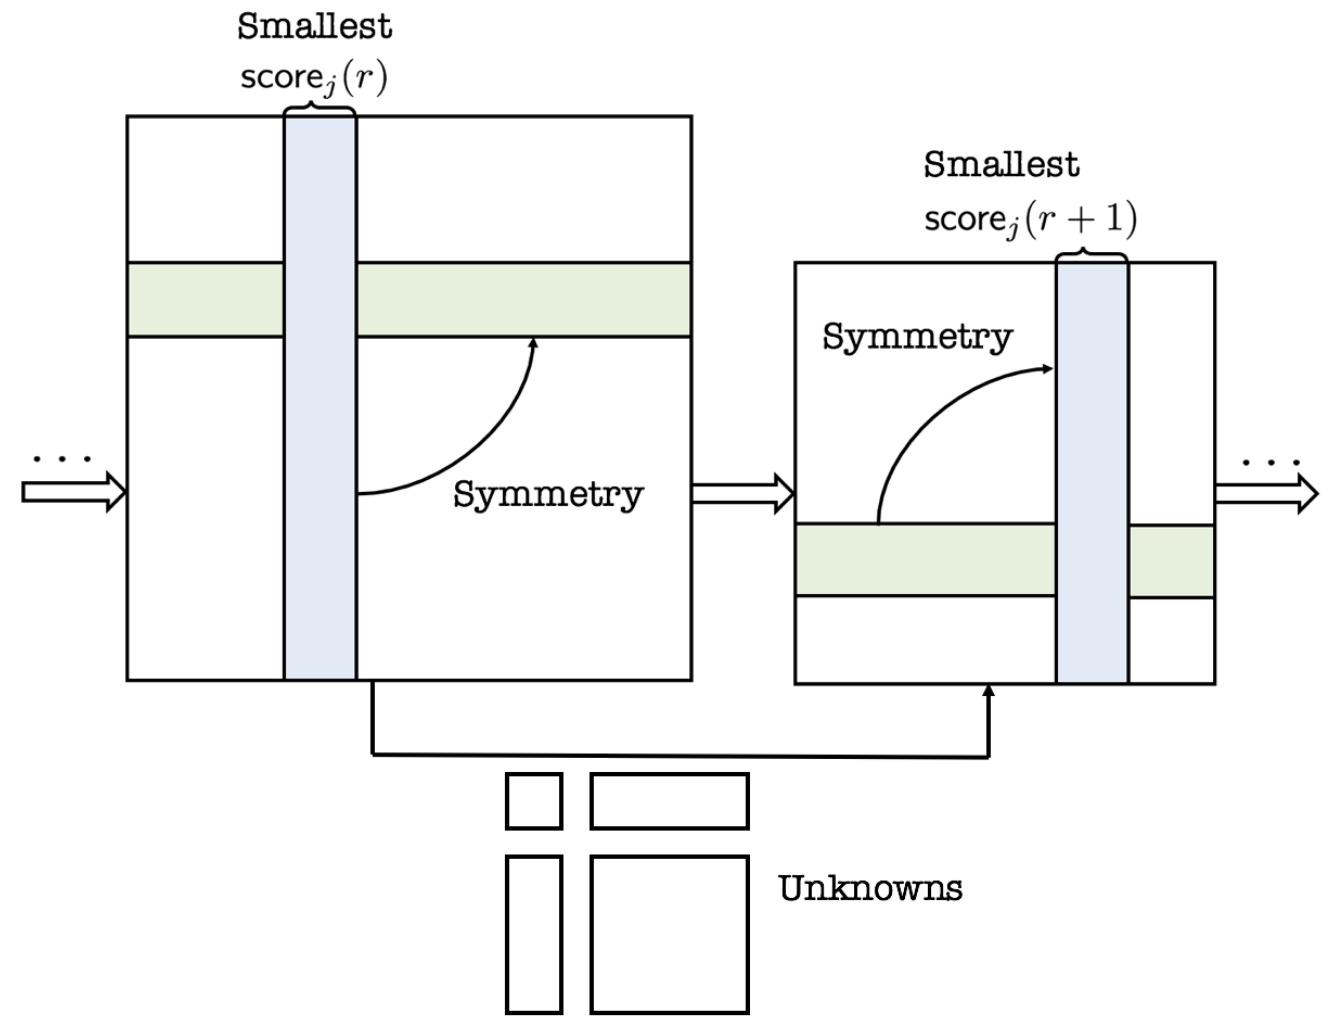
We propose an iterative algorithm that outperforms basis pursuit on star graphs. The algorithm is score-based, which estimates the easiest or the most confident rows/columns at each iteration and use the estimated information to solve a reduced system formed by historical data. The mechanism is presented below, with \(r\) denotes the round index and \(\mathsf{score}_{j}(\cdot)\) is some score function indicating the confidence level on each row \(j\).

Results
Applying the heuristic algorithm to learn admittance matrices in IEEE power system test cases leads to the following sample complexity results.

Compared with the basis pursuit, our iterative algorithm outperforms basis pursuit on star graphs.

The impact of measurement noise on sample complexity for recovery of the IEEE 24-bus test case is demonstrated below.

Reference
Li, Tongxin, Lucien Werner, and Steven H. Low. “Learning graphs from linear measurements: Fundamental trade-offs and applications.” IEEE Transactions on Signal and Information Processing over Networks 6 (2020): 163-178.