OpenCEM Dataset
6+ months of synchronized electrical measurements and ~15,000 natural language context records. Available as CSV, JSON API, or full SQLite database.
Database Tables
The dataset is distributed as a single SQLite database with two tables.
analog_measurements
Electrical measurements sampled at approximately 15-second intervals from both inverters via Modbus.
| Column | Type | Description |
|---|---|---|
read_ts | INTEGER | Unix timestamp of measurement |
inverter | INT | Inverter ID (1 = workstation, 2 = HVAC) |
battvolt | REAL | Battery voltage (V) |
battcurr | REAL | Battery current (A, signed) |
battsoc | INT | Battery state of charge (%) |
battchgpower | INT | Battery charging power (W) |
pv1volt | REAL | PV array voltage (V) |
pv1curr | REAL | PV array current (A) |
pv1power | INT | PV array power (W) |
outsumw | INT | Total output active power (W) |
outsumva | INT | Total output apparent power (VA) |
gridpowerw_a | INT | Grid active power phase A (W) |
linevolta | REAL | Grid voltage phase A (V) |
linefreq | REAL | Grid frequency (Hz) |
temper1..4 | REAL | Temperature sensors (°C) |
context
Natural language context records with timestamps and semi-structured JSON values.
| Column | Type | Description |
|---|---|---|
id | INTEGER | Auto-incremented primary key |
recorded | INTEGER | Unix timestamp when the context was recorded |
start | INTEGER | Unix timestamp when the context starts applying |
end | INTEGER | Unix timestamp when the context stops applying |
value | TEXT | JSON object with description, source, and metadata |
Sample Data
Preview of representative rows from the analog_measurements table.
| Timestamp | Inv | Batt V | Batt A | SOC % | PV W | Load W | Grid W | Temp °C |
|---|
Sample Time Series (Dec 26, 2025)
Context Records
The dataset captures both high-level user intents and low-level system events as natural language context.
"Scheduling 24h CPU-intensive robustness test for tomorrow."
cd .../geometry/test/robustness/b2 cxxflags='-O2'
"Extending test to 48h (multi-core numeric robustness)."
Unexpected System Reboot.
CPU: Intel XEON GOLD 6526Y, GPU: NVIDIA RTX 2000
Context JSON Structure
Each context record's value field contains a JSON object with source and textual_description keys. Sources include manual entry (62 records), workstation1_log (6,031), and workstation2_log (8,902).
{
  "source": "manual entry",
  "textual_description": "Tomorrow I will run a CPU-intensive, multi-core numeric robustness test for a day."
}
Physical Installation
The on-campus microgrid consists of two independent PV-battery subsystems powering a research workstation and HVAC unit.

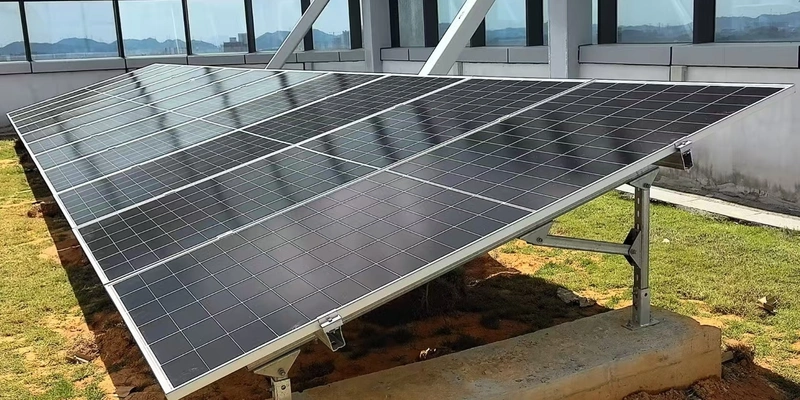
☀️ Solar Panels
- Cell Type: Mono, 2.12 m²
- Max Power: 480 W per panel
- Voc: 42.24 V
- Vmp: 35.64 V
- Efficiency: 22.18%
- Config: 2 arrays, 26 panels each
🔋 Battery
- Capacity: 200 Ah
- Nominal Voltage: 51.2 V
- Charge Voltage: 56.8–57.6 V
- Max Output: 6 kW
- Max Charge: 150 A
- Input Range: 40–60 V DC
⚡ Inverter
- Model: SPI4880V150-500P
- Rated Output: 8 kW (10 kVA)
- AC Output: 230 V, 50–60 Hz
- Efficiency: > 93%
- MPPT: 2 trackers, 500 V max
- PV Power: 2 × 5.5 kW
💻 Workstation 1
- CPU: Intel Xeon Gold 6526Y
- TDP: 195 W
- RAM: 64 GB
- GPU: Nvidia RTX 2000 ADA
💻 Workstation 2
- CPU: Intel i9 12900K
- RAM: 64 GB
- GPU: 2× Nvidia RTX 4090
❄️ HVAC
- Model: Royalstar KFRD-35GW
- Cooling: 3500 W (input 781 W)
- Heating: 2750 W (input 833 W)
- Coverage: 15–22 m²
- Noise: 37 dB indoor
API Access & Downloads
Access the dataset programmatically via our static JSON API, or download CSV files by period. All data is served from GitHub.
Download by Period
Drag the handles to select a time range. CSV files are split into half-month partitions (~30–55 MB each).
Data API
Dataset files are served directly from GitHub. No authentication required. The metadata index is JSON; measurements and context are half-monthly CSV files (suffix a covers days 1–15, b covers 16–end).
| Endpoint | Description | Example |
|---|---|---|
/api/v1/meta/index.json |
Metadata index: available dates, record counts, schema | Try it → |
/data/measurements/{YYYY-MM}-{a,b}.csv |
Half-month measurements CSV (all inverters, ~12 s interval) | 2025-12-b → |
/data/context/{YYYY-MM}-{a,b}.csv |
Half-month natural-language context records | 2025-12-b → |
/data/{measurements,context}/ |
Browse all available half-monthly files | Browse → |
Base URLs:
https://opencem-platform.github.io/opencem-datasethttps://github.com/OpenCEM-platform/opencem-dataset/raw/mainCode Examples
import requests, pandas as pd

meta_base = "https://opencem-platform.github.io/opencem-dataset/api/v1"
data_base = "https://github.com/OpenCEM-platform/opencem-dataset/raw/main/data"

# Get metadata index (dates, counts, schema)
meta = requests.get(f"{meta_base}/meta/index.json").json()
print(f"{meta['stats']['total_measurements']:,} measurements across {meta['stats']['measurement_dates']} days")

# Load a half-month of measurements directly into pandas
df = pd.read_csv(f"{data_base}/measurements/2025-12-b.csv")
print(df.head())const metaBase = "https://opencem-platform.github.io/opencem-dataset/api/v1";
const dataBase = "https://github.com/OpenCEM-platform/opencem-dataset/raw/main/data";
// Fetch metadata index
const meta = await fetch(`${metaBase}/meta/index.json`).then(r => r.json());
console.log(meta.stats);
// Fetch a half-month of measurements as CSV text
const csv = await fetch(`${dataBase}/measurements/2025-12-b.csv`).then(r => r.text());
console.log(csv.split("\n").slice(0, 3));# Inspect metadata
curl -s https://opencem-platform.github.io/opencem-dataset/api/v1/meta/index.json | python3 -m json.tool | head
# Download CSV for a half-month period
curl -LO https://github.com/OpenCEM-platform/opencem-dataset/raw/main/data/measurements/2025-12-b.csvResponse Format
Measurements and context files are CSV; metadata is JSON. Example record shapes (shown as JSON for readability):
[
  {
    "read_ts": 1765843201,
    "inverter": 1,
    "battvolt": 54.3,
    "battcurr": 2.5,
    "battsoc": 98,
    "pv1volt": 287.1,
    "pv1curr": 0.7,
    "pv1power": 205,
    "outw_a": 267,
    "outsumw": 272,
    "gridpowerw_a": 0,
    "temper1": 27.7,
    "temper2": 41.3,
    ...
  },
  ...
]Manual entry (human-annotated event):
{
  "id": 9441,
  "recorded": 1765938600,
  "start": 1765939020,
  "end": 1765939020,
  "value": {
    "inverter": 2,
    "source": "manual entry",
    "textual_description": "AC in office turned on."
  }
}
Workstation log (auto-captured compute task):
{
  "id": 9443,
  "recorded": 1765958636,
  "start": 1765958636,
  "end": 1765958703,
  "value": {
    "inverter": 1,
    "source": "workstation2_log",
    "device": "workstation2",
    "task_type": "CNN fitting, GPU load",
    "model": "vgg13",
    "optim": "sgd",
    "dataset": "CIFAR10",
    "batch_size": 128,
    "epochs": 2,
    "model_params": 133047848,
    "llm_estimated_task_effort": "medium",
    "textual_description": "The model vgg13 is fitted on CIFAR10 using sgd for 2 epochs with bs=128."
  }
}